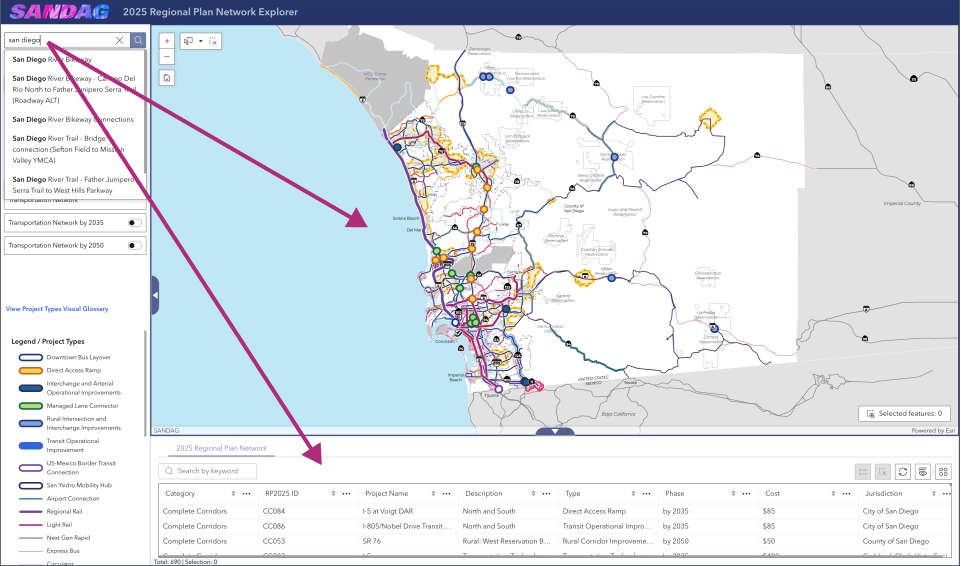
The 2025 Regional Plan Network Explorer attempts to make technical information from Appendix A of the Regional Plan more accessible to everyone, from local government staff and community-based organizations to the general public.
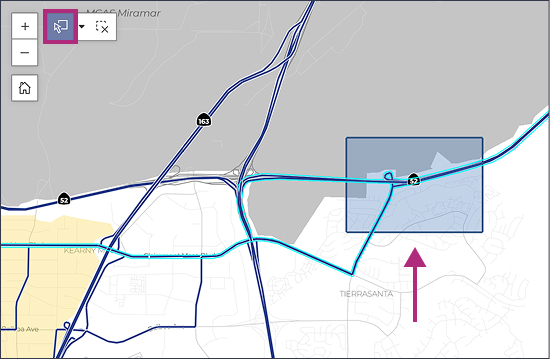
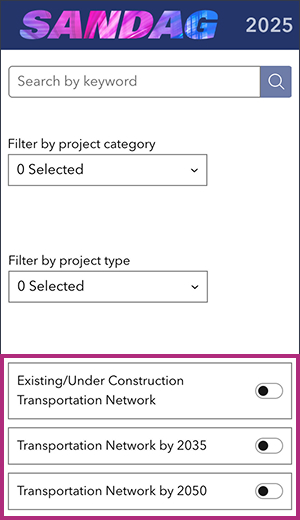
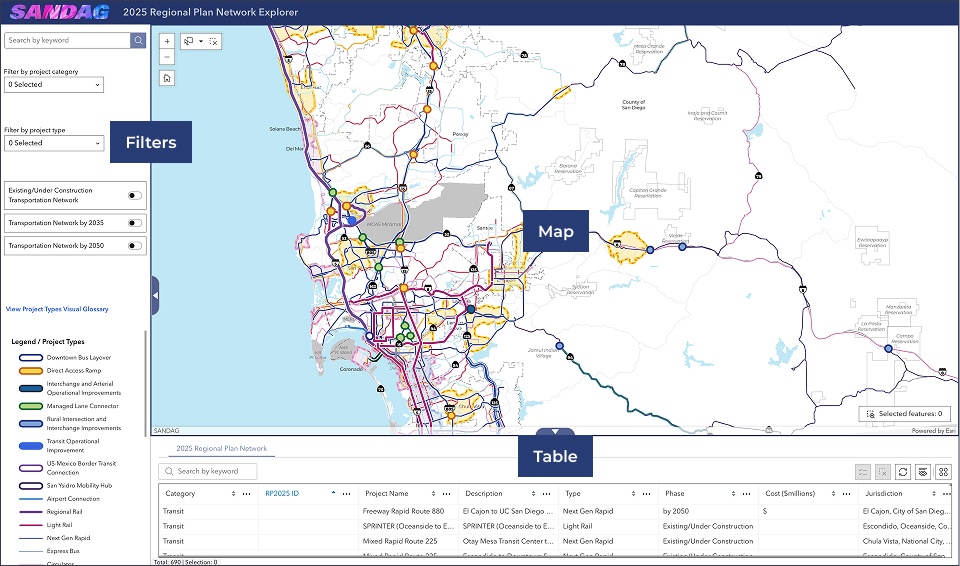
The default view has three components (map, table, and filters) and includes all projects in the 2025 Regional Plan across the entire region.
- Map
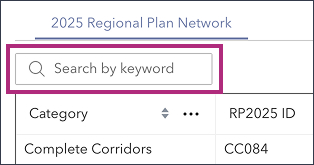
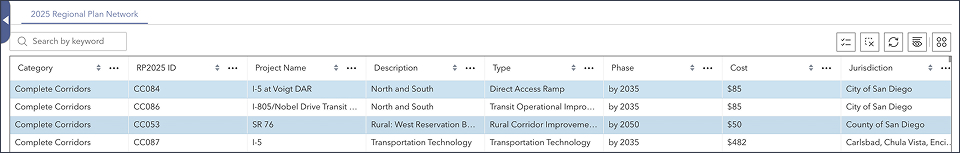
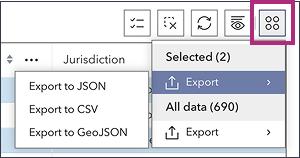
- Table
- Filters
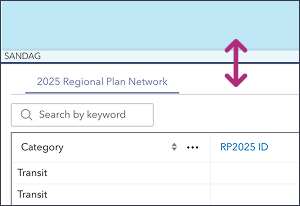
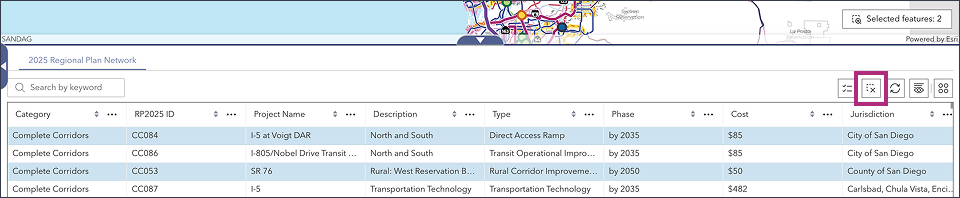
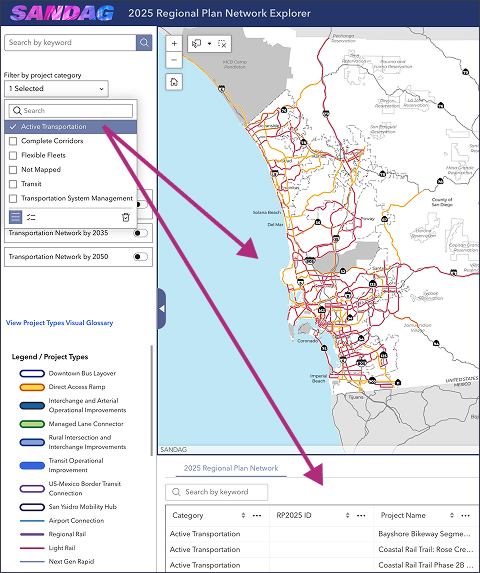
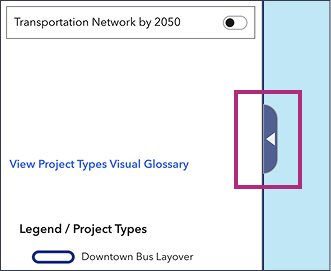
Hide or reveal the filters or table panes by clicking the white arrows in the blue tab.
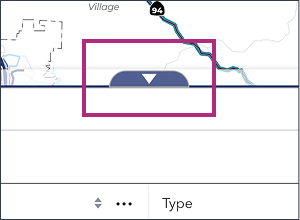
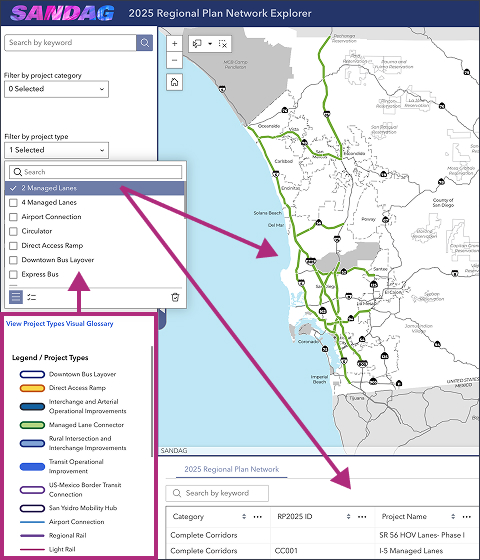
Enlarge or reduce the filters or table panes by clicking and dragging from the center of the blue line.